Introduction
My rowing background stretches back to 1991 and predates the internet and a google search. Back then if you wanted to improve your training plan you either sat down with a rival coach over a beer and a meal, or you checked out the noticeboard at the back of the winning crews boathouse for the piece of paper of their training plan.
We also got to include snippets of cutting-edge research going on in places like the Australian Institute of Sport who, leading into the Sydney Olympics of 2000, were investing a lot into rowing-specific sports science and winning medals on the world stage, but you always felt like the really good knowledge was being kept secret.
Back then there were no power meters or GPS trackers of speed, and even the use of the erg and heart rate monitors for training was not nearly as common as now. So most of the training plans were prescribed to athletes using mainly time and stroke rate. If you were lucky you had some markers on land for distance, but with current and weather, these were generally only used for ‘special events’ like seat racing or the final preparation for a big regatta.
There were a lot of fast and successful crews who trained like this and the legacy is that nowadays we still see a retro-like affinity to using stroke rate and time to prescribe and monitor training, despite such methods being out of date and superseded by even the most basic technology of a Concept2 erg.
Unless we want to stay stuck in the 1990’s today even the rawest coach will want to use the massive amount of knowledge and data on the internet, combined with the ever-present technology in our sport to get the chance to use the best sports science to guide their athletes more effectively to peak performance.
Training Plan Basics
Measuring performance capacities and progress
To build your training plan you will want to know how to prescribe training, how to monitor training, and how to track the impact of that training on performance.
Let's start with the basic concept that there are two key energy systems that an athlete will use for a traditional 5k head race or 2k sprint. Your aerobic energy system is linked to your endurance capabilities, and your anaerobic energy system is linked to your sprinting abilities.
Both aerobic and anaerobic energy systems contribute to a rowing 2k performance, and the faster you go, or the shorter the distance, the greater the relative contribution from the anaerobic system.
As a coach, you will want to train both systems in your athletes, and you will definitely want to measure the performance progress your athletes make to ensure that your training plan works the way you intend. You are probably already doing this with a combination of erg tests like the common 2km and 6km. If you record a few of these at different distances, you can create a Performance Profile for each athlete like the chart below automatically created within the CrewLAB app.
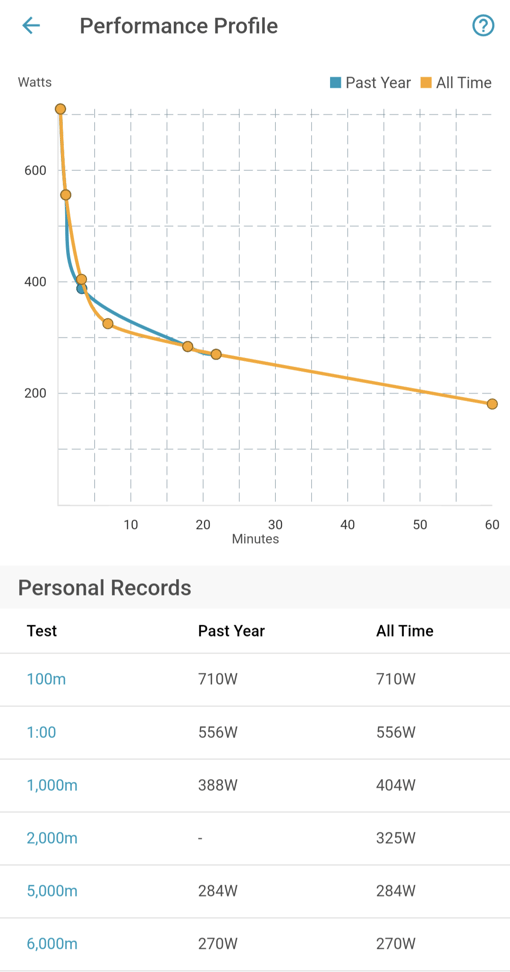
Each athlete will have a different profile that will show if they have sprinting (anaerobic) or endurance (aerobic) strengths and weaknesses that you can either try to rebalance or magnify with subsequent training.
Both aerobic and anaerobic energy systems contribute to a rowing 2k performance, and the faster you go, or the shorter the distance the greater the relative anaerobic contribution. Generally, the suggestion is that a 2k race is around 80% aerobic and 20% anaerobic, for masters racing over 3 minutes it might be closer to 50% for each system.
Why track your training?
Given you are probably already tracking the performance of your athletes using things 2k erg tests maybe you want to know why that is not enough, or you think that tracking training is expensive or difficult. Firstly remember that in the modern world where smart watches and GPS trackers are everywhere, almost all of the key training data is already being created by your athletes. It is a rare team that would have no one tracking heart rate, and so the historic roadblock of lacking the technology to track training is no longer an issue. Secondly, the obvious benefits listed here are probably too critical to your team to ignore
- identify your athletes' strengths and weaknesses
- increase accountability
- individualize your athletes’ training
- improve collaboration between coaches and the team. help them to help you!
- accurate self-assessment of training by athletes
- pace races better
- quantify your athletes' fatigue, nutrition, and spot overtraining and sickness earlier
- link indoor training efforts with outdoor training efforts
- find the impact of changes like jet lag, altitude, heat
- add meaning to the heart rate and RPE data that is probably already being recorded
Monitoring Training
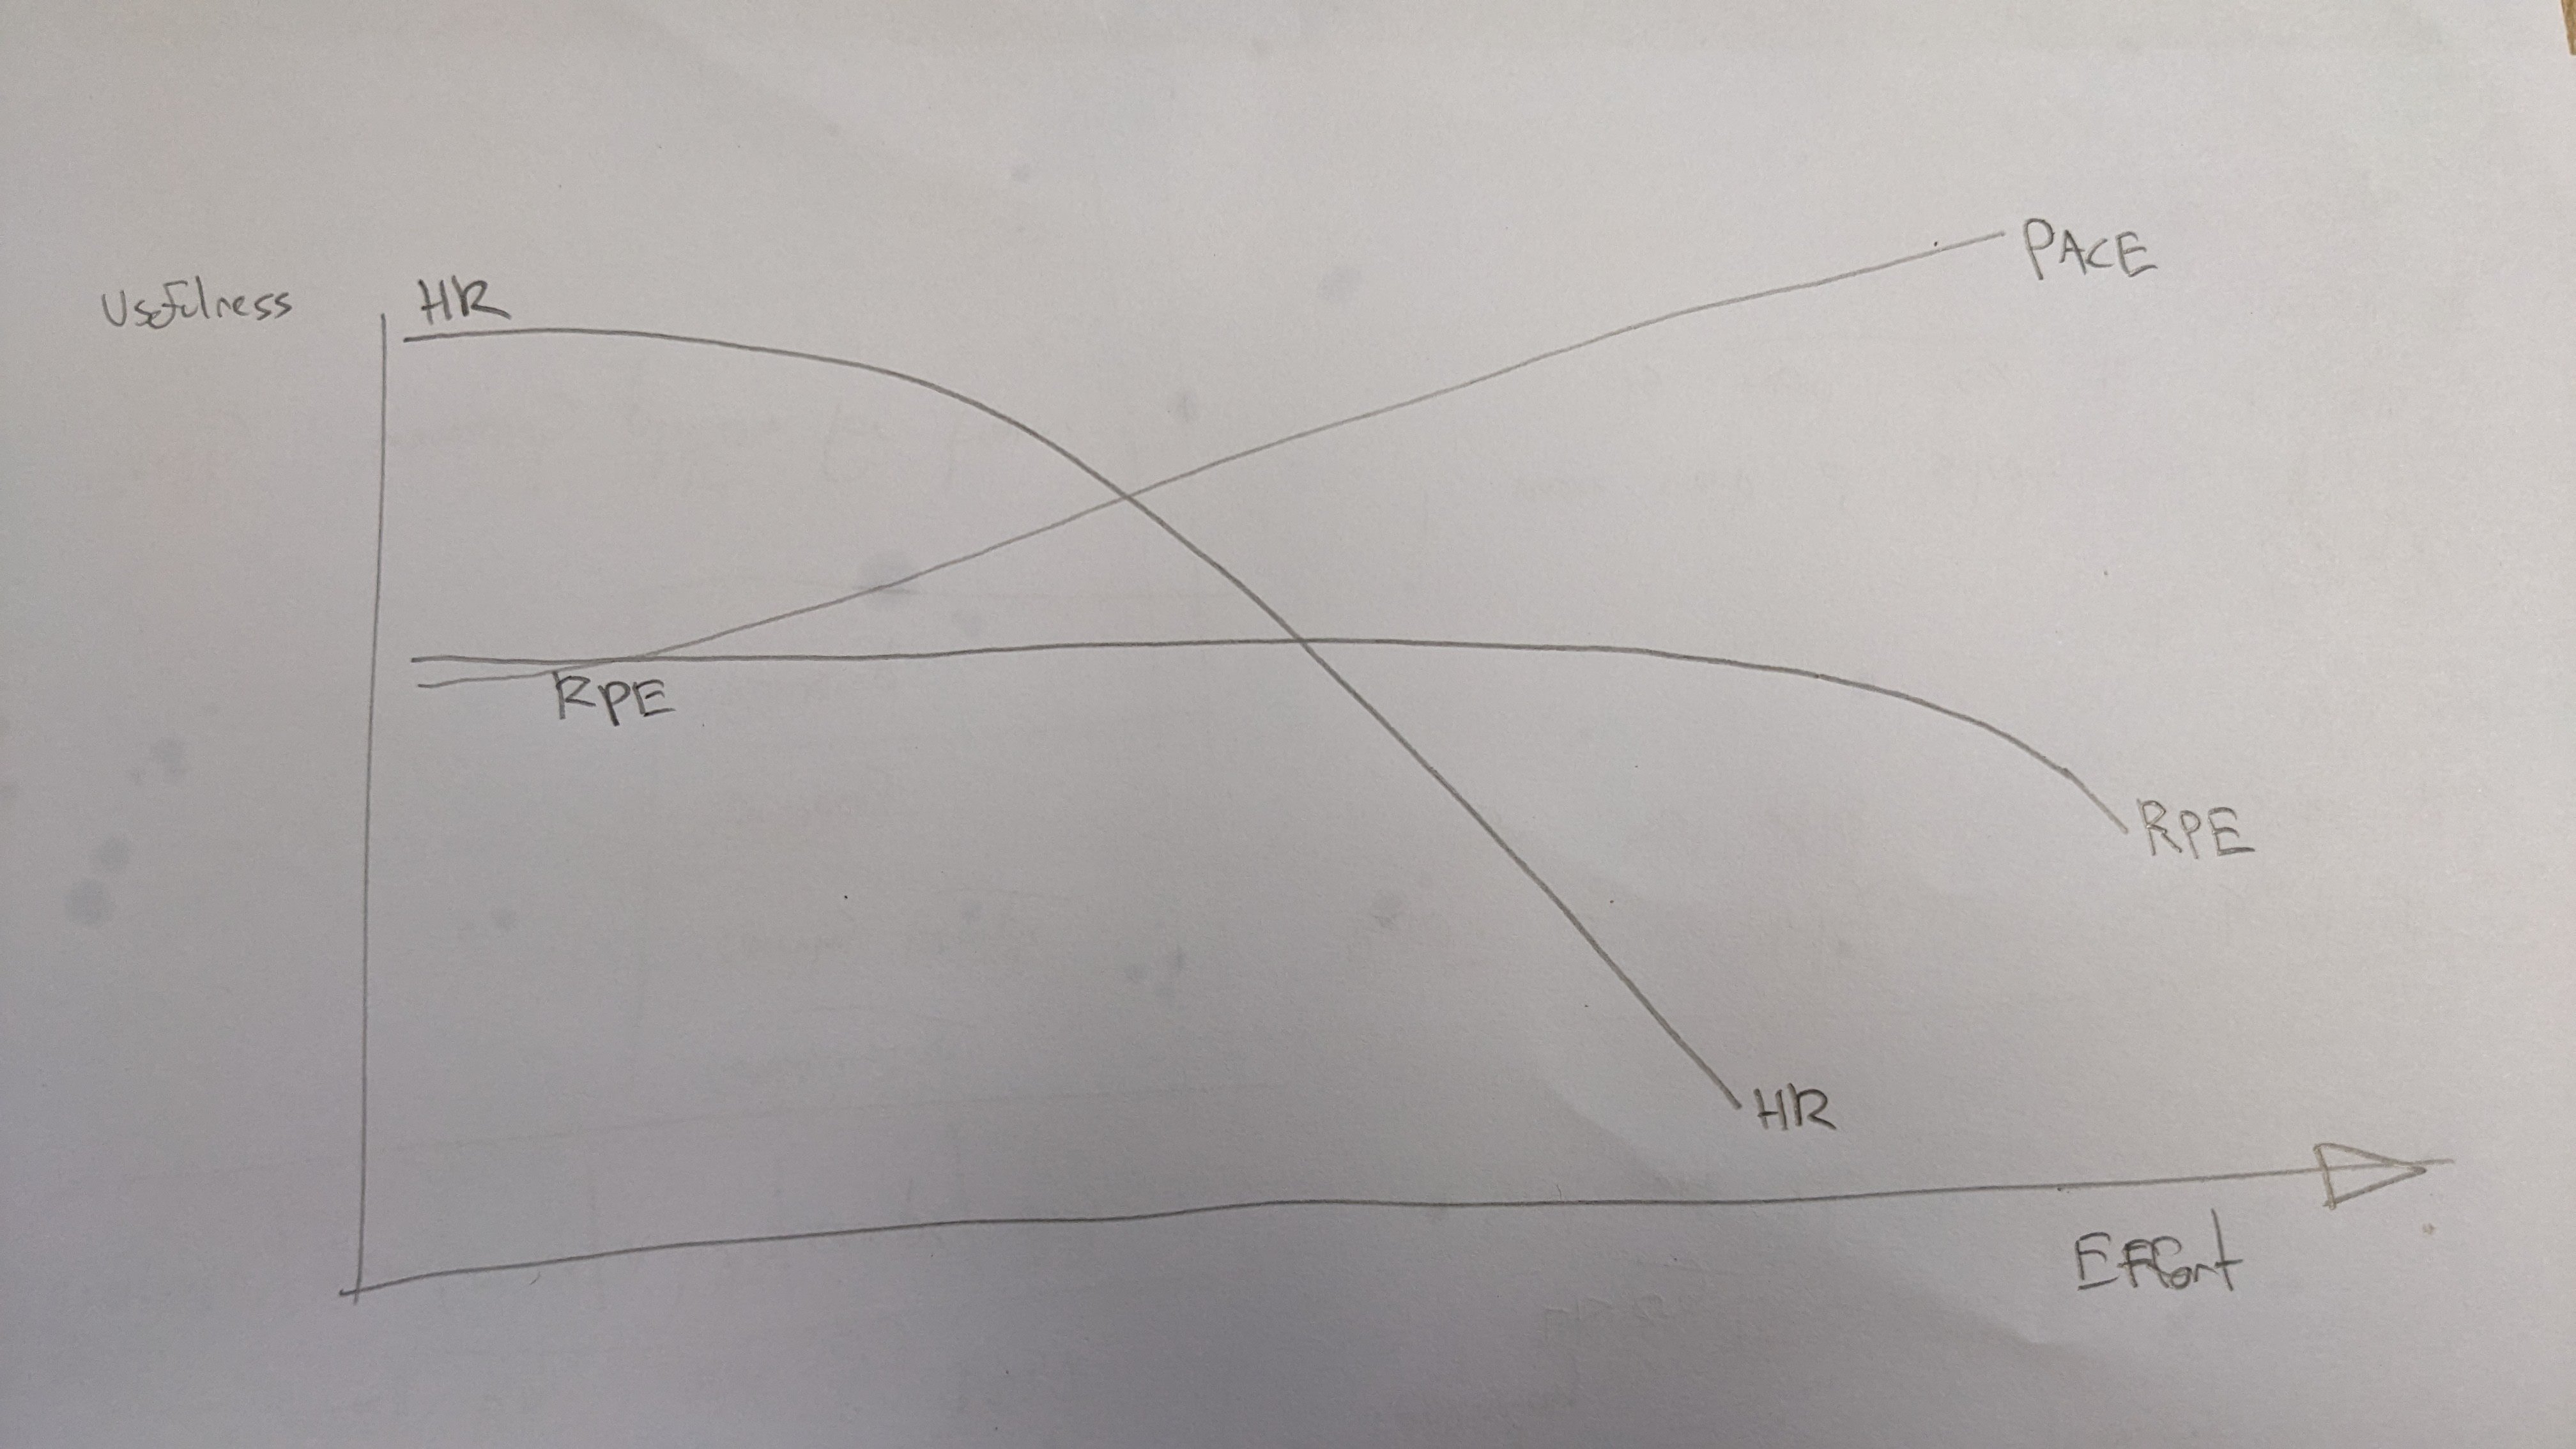
Having measured the athletes' physical capacities, the focus is now to monitor training as they follow your plan. There are three well-established and interconnected ways to monitor training, called by Stephen Seiler the Training Monitoring Trinity. (https://youtu.be/FdVOF8BNKJU?feature=shared&t=2596)
- Internal Physiological Responses (Heart Rate and Lactate)
- Psychological Perceived effort or exertion (RPE)
- External Work Output (Pace and Power)

So now we have three tools to monitor training and while all three are useful by themselves, they each have their weaknesses, and so should ideally be used together.
RPE is the most useful and easiest to use, especially as it free and can be used across all training activities from running to cycling to rowing without any technology. This should be used by coaches the most often, however it is the crudest, and it can be difficult to monitor complex anaerobic intervals where time is spent at both a low and high RPE in the same session.
Heart Rate is the most common way to measure physiological responses, but has a time lag that makes it less useful for shorter intervals when you are training your anaerobic system.
Pace in rowing can be the hardest to measure for an individual, as they are often part of a crew that might be getting impacted by weather and so you get the pace for a group of people and not specific individuals, however Power meters are easy to find on land on every erg, and individual power meters are slowly becoming more common in boats. For aerobic work, Power becomes relatively less useful relative to heart rate and RPE due to the goals of aerobic exercise.
Charting this would look similar to this.
Phillip Bellinger did some interesting research which showed that when monitoring load the training intensity distribution of the same session can actually look quite different using each of these measures, and is another strong reason why you need all three points to get a better picture of training.
While reinforcing the advice that all three measures should be tracked and recorded, consider the principle that focusing on the HR and RPE (above Power) is probably more beneficial for your aerobic-focused training. Likewise, due to the well-known time lag in HR response, focusing more on Power and RPE (above heart rate) is a better system for monitoring of your anaerobic-based training.
Prescribing Training
Having decided to track training the next step is to define the different types of training and how you will communicate it to your athletes.
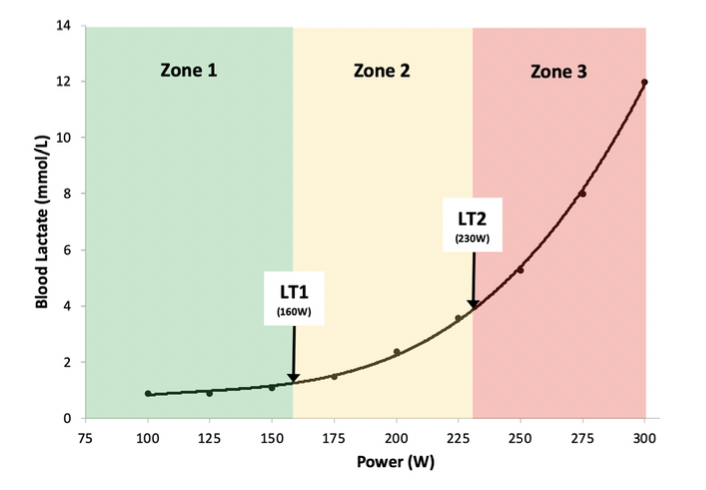
Let's divide training efforts into three key regions with two key markers or transition points
- the aerobic threshold marker (usually defined by the blood lactate curve)
- the anaerobic transition marker (Can be approximately defined by a wide variety of methods. Options include FTP, vVo2Max, CV, CP, MLSS, OBLA, or by using lactate)

Each marker can be associated with a different energy system of the body
- the aerobic (endurance system)
- the anaerobic (sprinting system)
You can use these two markers to gauge progress and prescribe training for those two energy systems.
Training for the Aerobic System
Rowing coaches generally do a very good job of training this system, or at the very least, and like most endurance sports, simply lean into the blunt advice that more distance is better. For those wanting to follow best practices, the use of blood lactate measurements to identify and assess endurance athletes is common and has been used for decades. The measurement of the blood lactate response to exercise has been shown to have strong correlations with endurance exercise, and there is a lot of data suggesting that “blood lactate thresholds may provide best indices of exercise intensity by which to prescribe training and by which to optimise training intensity. (Standardisation of physiology nomenclature Tanner and Bourdon 2006) https://www.researchgate.net/publication/242659805_STANDARDISATION_OF_PHYSIOLOGY_NOMENCLATURE.
We will keep this simple and use a lactate of 2.0mmol as the aerobic threshold marker. Your goal for training the aerobic system most effectively is to stay just under this lactate level. Using the adage of “your light is not light enough and your hard is not hard enough” used within the polarized training models identified by Seiler in his paper on Norwegian International Rowers (https://onlinelibrary.wiley.com/doi/abs/10.1046/j.1600-0838.2003.370.x)
Most dedicated rowers will be looking to include a good volume of their training (10 hours or more) below this aerobic threshold. Usually, you can also associate a heart rate with the threshold if lactate testing is done and then that heart rate can act as the ceiling.
If you are unable to do lactate testing you can approximate it by using 2k erg test times and derive it from there.
Training your Anaerobic System
This is the main area of training that many rowing training programs are deficient in and find themselves decades behind compared to other endurance sports such as cycling which have thoroughly embraced Watts-based power training and pace-based training plans.
Power meters are ubiquitous in rowing already with every erg being one. You just have to push the button and change the units from split to watts. Using Watts is both more accurate and considerably easier to program training because the scale is linear. So 400Watts is twice as hard as 200Watts. And 404Watts is 1% harder than 400Watts. This linear relationship makes it much easier to calculate the progress and improvement of an athlete.
Having decided to use Watts, the next step is to pick the process of defining the marker that represents an athlete's anaerobic system.
This is a complex decision given the vast array of options here. Here is a sample of some of the more well-known options, and how they are calculated.
- Anaerobic Threshold (AT) - The workload causing a rapid rise in blood lactate indicating the upper limit of equilibrium between lactate production and clearance.
- Onset of Blood Lactate Accumulation (OBLA) - Fixed 4 mmol.L-1 value (Sjodin and Jacobs 1981)
- Functional Threshold Power (FTP) - Often determined as 95% of the average power during a 20-minute time-trial test
- Maximal lactate steady state (MLSS) - Highest constant intensity of exercise that can be maintained for a longer period without the continuous increase in blood lactate concentration
- Lactate Threshold 2 (LT2) - The intensity indicating the upper limit of equilibrium between lactate production and lactate clearance. (Tanner et.al 2006)
- Critical Velocity (CV) - Mathematical measure of a maximum steady state of predominantly aerobic metabolism
- Velocity at Vo2max (vVo2max) - The minimum velocity at which maximal oxygen uptake (VO2max) is reached
So you can choose any version of the concept, but given the lag issues with heart rate, and the challenges in getting blood lactate, picking a measure that uses Watts makes a lot of sense.
We have created a derivative of Critical Velocity that works well on the Concept2 rowing erg and is easy to replicate for CrewLAB. It has proven to be a powerful predictor of performance and has allowed us to increase the accuracy of prescribing threshold and anaerobic training intensities so that athletes are training smarter, not harder.
Once the marker of the Anaerobic Transition has been picked, you can now prescribe training using that marker as an anchor and can check as often as you like if the athlete is progressing and getting faster towards a target.
Exercise prescribed according to relative intensity is common in the sports science literature and is intended to produce a roughly equivalent exercise response in individual athletes with different absolute exercise capacities.
The most common training for this energy system is sprint intervals, done at controlled speeds and not at the “as fast as you can” often seen in rowing. Manipulating the interval training variables such as the Watts, interval lengths and rest period, gives a coach effectively infinite options for training. This has also led to research in this area exploding in the last 20 years since Billat wrote on interval training for runners in this article linked here
Given the high demands that intervals and anaerobic training place on the athlete, it is recommended that the coach has the goal to identify the minimum optimum amount of training. Recovery and avoiding overtraining becomes a key consideration and therefore controlling Watts, rather than going all out is an obvious solution.
Where to start
- switch to watts on your erg!
- use Watts to manage performance
- build a record of what you are doing for reference
- tracking changes in fitness
- learn to predict the Trinity (HR, RPE and Power) by understanding the relationship
- Find your two threshold points
- 2k erg test, 6k erg test 1 min erg test, 3min EP test
- Aim to be patient and consistent.